Investing and Trading Blog

Your ultimate resource for mastering investing, stock market strategies, and trading techniques with confidence.

A tablet displaying a detailed digital financial trading interface with various graphs, charts, and numerical data. The screen shows candlestick charts with green and red indicators, illustrating market trends and stock prices.

Gallery

Explore our visual resources for investing and trading insights.

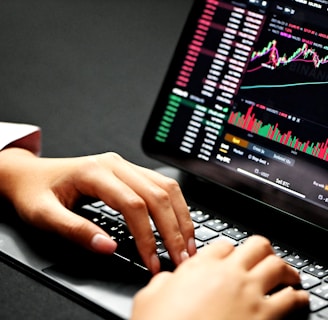
Hands typing on a laptop keyboard with a screen displaying financial graphs and stock market data. Multiple charts and numbers are visible, indicating online trading or financial analysis.
A hand holding a smartphone displaying a stock market chart with candlesticks and line graphs. In the background, there are blurred Christmas tree lights creating a festive ambiance.
A person holds a smartphone displaying a stock market application with graphs and financial data. A laptop is visible in the background, slightly blurred.